Plot Database Spans and Soft Qualities
This example shows how to load the slabs database and plot some information from it.
from buildings_analytics.queries import plot_soft_quantities
from buildings_analytics.queries.query import plot_typical_spans
from buildings_analytics.queries.query import read_database
from buildings_analytics import TEMP
# Load the slab database
df = read_database()
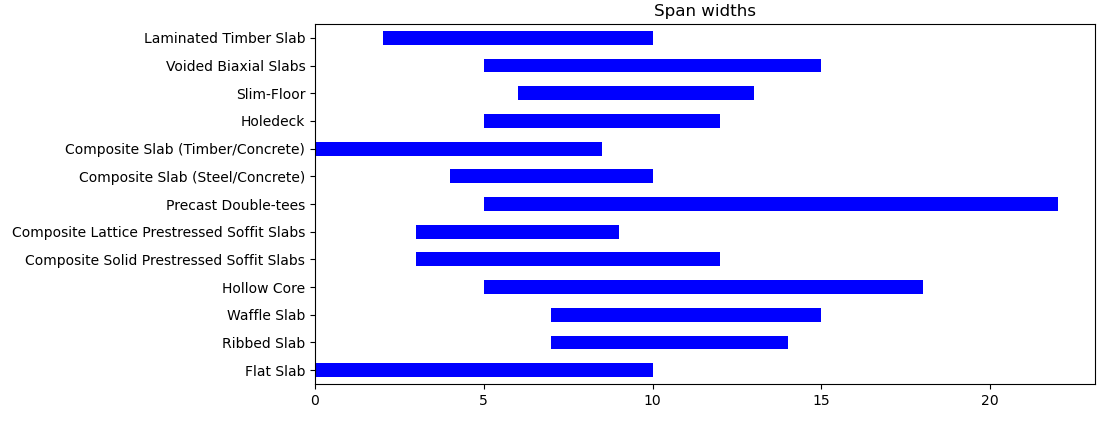
# Plot typical slabs spans
plot_typical_spans(df)
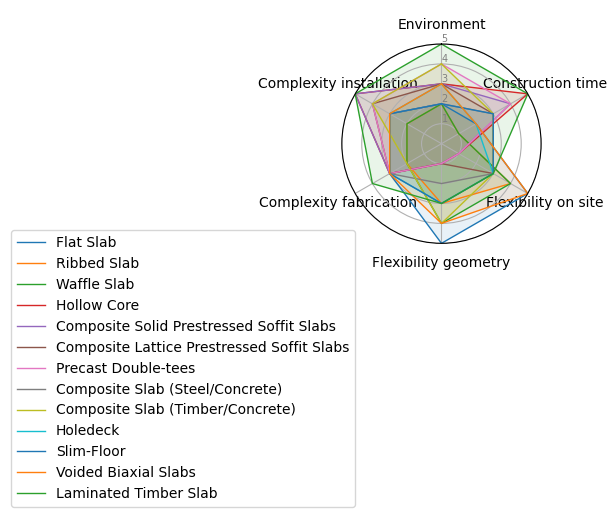
# Plot soft quantities
plot_soft_quantities(df,path=TEMP+'/soft_quantities.png')